jbartual.wordpress.com

I’ve consolidated my blogs into a single one under http://jbartual.wordpress.com

From now on I will publish new content only on this new blog under the Business Intelligence category.

Please follow me in that new blog… Soon I will start publishing my experiences with Power BI and Office 365 🙂

Posted in Uncategorized

New Year… New life… New architecture

The new year is bringing big changes for me. Even though I’m still in the same company we have decided to bring a totally new BI platform, the good old SAP BW plus his companion the BO Suite. As I’m not a technical expert in this platform, I’ve been blessed to be nominated the BI Lead, not only for it but also for the previous Microsoft platform. My tasks will span Project Management, Technical Lead, Developer and Support. Luckly we have contracted a SAP BI specialist that will focus on the development and support of the SAP BI platform and I will concentrate on the Project Management and Technical Lead for the SAP BI while doing little developments and support in the Microsoft BI until we can fully migrate all the developments to the SAP one. Not bad!

I know that some people will not be happy to have almost 15 years of experience in one platform, in my case Microsoft, and then all of a sudden being thrown to a different one, and as different as SAP. But I’m happy about it. For a long time I wanted to put some distance between me and the pure and hard technical side of IT and focus more on the management and leadership of technical solutions. So I’m embracing this opportunity as a challenge and as a new era in my IT career.

From now on you will see a different kind of posts, which I hope they can be useful to anyone out there, in the vast realms of the Internet. The posts will revolve around architectures, PMBOK project management comments, business gatherings and experiences with business users, etc. Expect me to share my templates and diagrams multiple times as I keep learning and evolving in this new life.

Being this the very first post of this new era, we shall start by the vision, or to be a bit more precise the system architecture.

NewArchitecture

As you will see my skills in the Microsoft BI platform will not be totally wasted. As we rely on SharePoint for our intranet, the easiest way to bring data from a SharePoint list is to use the SSIS connector and dump the data into a SQL Server table. Also I have learned that if you need to integrate with strange systems, like IP21, whose experts are outside the IT department, it’s quite easy to ask them to dump whatever data we need for our BI analysis into a table in SQL Server, and from there you can import your data into your BI system using an ETL tool. For these reasons, we will be using SQL Server as a “data middleware” or some people would like to call it a data staging area.

I do like the idea of having a place where the data stops before entering the BI platform. A place where all data has the same format, can be logged and inspected easily. This approach helps you to industrialize your architecture. The path is clear, the methods and tools are robust, and on top of all it gives you a great flexibility and peace of mind regarding version and inter-application compatibilities.

You can see SAP PI also in the architecture and some people could argue that if you have SAP PI you don’t need SQL Server as a staging/middleware. But this for me is not true. Both products could be used for the same purposes, but having the capability doesn’t mean that you should, or better abuse, it. SAP PI, as other middlewares like BizTalk, are good dealing with lots of light messages. A light message is a message carrying a small set of data with it. I always give the same example, think about an ATM network for a bank. All the transactions yield from the ATMs go to a middleware and this in return sends the messages to the appropriate back-office systems in the bank. Those transactions are high in number but low in weight. A middleware is an ideal solution for this scenario. But if you would like to kill a middleware, start making medium data transfers through it and you will see how the performance is heavily impacted. If you would like to transfer medium to high volume of data between two or more systems, there is nothing better than a good old database with an ETL tool. We could say that if the number of messages is low but the data being transfered is high, then nothing can beat a database. For these reasons I have placed SQL Server as the main “data middleware” and SAP PI on the side for those cases where is suitable to go directly for it.

That’s enough for the first post of the year 2014. I wish you a very happy new year!

Posted in Architecture, SAP

Excel 2013 Macro to set a filter

Recently I’ve been updated to Office 2013. Everything looks like is working smooth as always and even now Excel 2013 has a nice smooth effect when new data is displayed.

While I was working on a new report I had a reencounter with an old friend (or foe)… the Excel Macro!

A while ago, I wrote a short macro to set up the month and year filters every time the Excel file is opened, the idea is to set the filters to the current year and month. The good news are that this time I’ve created a new version of the filter in less than 1 hour. Actually in just 5 minutes! I caaaaaaaaan’t believe it…

Maybe is Excel 2013, maybe is my vast knowledge of Excel and VBA internals (joke), or even is just luck… but here is the script:

Sub CurrentMonth() 
ActiveSheet.PivotTables("PivotTable1").PivotFields("[Dim Purchase Document Dates].[PD Date Year].[PD Date Year]").ClearAllFilters 
ActiveSheet.PivotTables("PivotTable1").PivotFields("[Dim Purchase Document Dates].[PD Date Year].[PD Date Year]"). _     
    CurrentPageName = "[Dim Purchase Document Dates].[PD Date Year].&[" & Trim(Str(Year(Date))) & "]"
ActiveSheet.PivotTables("PivotTable1").PivotFields("[Dim Purchase Document Dates].[PD Date Period].[PD Date Period]").ClearAllFilters 
ActiveSheet.PivotTables("PivotTable1").PivotFields("[Dim Purchase Document Dates].[PD Date Period].[PD Date Period]"). _     
    CurrentPageName = "[Dim Purchase Document Dates].[PD Date Period].&[" & Trim(Str(Month(Date))) & "]"
End Sub
Tagged with: ,
Posted in Excel

Fact Tables with Multiple Dates

Tricky issue… You have a fact table that has more than one date. In our example the FactPurchaseDocument table. Each Purchase Document (PD onwards) has two important dates, Creation Date and Document Date (a.k.a Posting Date). Users some times want to see PDs created on 2013 regardles of their document date or PDs with a document date year of 2013 regardles when they were created.

Before jumping to the solution, it is worth to mention that FactPurchaseDocument is not a lonely fact table but it is related to other fact tables like FactPurchaseDocumentItem and FactPurchaseRequisition (for those in SAP world these tables will sound very familiar). PDs are the header for Purchase Document Items (PDI onwards). Then one PD act as header for many PDIs. PDIs on their side have also more than one important date like Creation Date, Delivery Date, etc.

Some reports require the fact tables to be filtered by certain dates but not for others, for example, a report that retrieves all PDIs and PDs by PDIs’ Delivery Date in the year 2013. In this case it can happen (and following Murphy’s laws it actually does) that a PDI delivered in 2013 has as header a PD created and posted (with document date) in 2012. If these two fact tables share a Time dimension and you set the filter to 2013 only, the result set will be incomplete.

It is clear that what we need is the possibility to select which date we would like to filter each fact table in the report. Ideally in our report we would like to select to filter by year 2013 the PDIs delivery date only and that this selection doesn’t affect the PDs fact table.

Some people would say that you always need to chose one and only one date for each fact table as the one to act as a filter. But this solution will not support our users’ needs and we’ll make us ending up with inaccurate and inflexible reports.

This scenario needs a solution that is not that obvious. I’ve tried with role-playing dimensions where you have one unique Time dimension that is related to all significant dates in all fact tables (by a role-playing dimension). We can say that this could be the typical and “by-the-book” approach. After several tests I’ve concluded (right or wrong) that when querying the cube from an Excel pivot table, the filter applied to one role-playing dimension (derived from the shared Time dimension) gets actually applied to the shared Time dimension and this one propagets the filter to all the role-playing dimensions. As I said I could be wrong in my theory, but it seems that I’m not alone…

The solution that I’ve found is based on Boyan Penev’s blog entry. Basically once a fact table has more than one significant date (those dates that you would like to filter the fact table by) then you would need to build a separate date dimension for it. Think about it as it was not a date dimension. Imagine that this new dimension is just another “DimWhateverType” dimension that belongs to the fact table.

In my case I called this dimension “DimPurchaseDocumentDates” and it contains the Purchase Document ID (PDID), the actual date (PDDate) and a field called PDDateType that will help to select which kind of date I would like to filter by in the report. In my particular case this last field is a nvarchar (255) that will contain either “PD Created” or “PD Document Date” strings.

The DimPurchaseDocumentDates contains one row for each significant date in the FactPurchaseDocument table and it is fed in the ETL right after the fact table has been populated. As an example if we have a PD with PDID = 1, CreationDate = 20121225 and DocumentDate = 20130401 (Chirstmas day for creation date and April’s Fools day for document day) in the fact table, the dimension table will have two entries one corresponding to Christmas day with PDDate = 20121225 and PDDateType = “PD Created” and another row for April’s Fool day with PDDate = 20130401 and PDDateType = “PD Document Date”.

PDDiagram_small

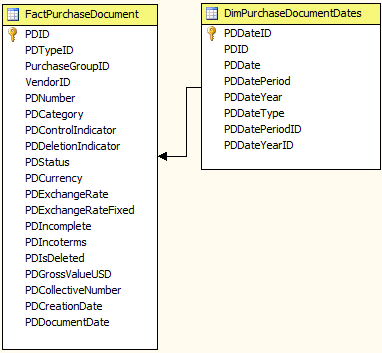
(Note: The “DimPurchaseDocumentDates” table has 4 additional fields (PDDateYearID, PDDateYear, PDDatePeriod, PDDatePeriodID). PDDateYear and PDDatePeriod are configured as a hierachy in the dimension to make navigation easier for the user. The ID fields will be explained later.)

Next step will be to add the “DimPurchaseDocumentDates” table as both a dimension table and a fact table. This will be necessary to configure the FactPurchaseDocument table to be related in a Many-To-Many relationship to the DimPurchaseDocumentDates table:

PDDimensionUsage_small

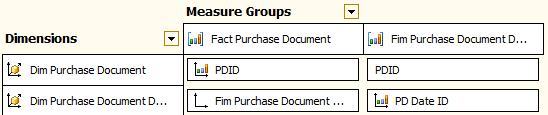
(Note: I’ve changed the name of the DimPurchaseDocumentDates table to Fim Purchase Document Dates when is being used as a fact table for an easier reading of this post).

As you can see in the screenshot, the dates dimensional table is joined to the Fact Purchase Document table using a Many-To-Many relationship (which requires the Dim Purchase Document table (which is the Fact Purchase Document table but being used as a dimension) to be related to the Fim Purchase Document Dates table using a regular relationship by the PDID field).

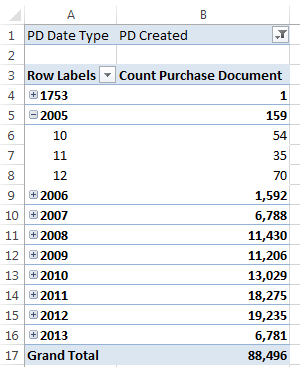
Now just create a pivot table in Excel and filter the dates to test the data:

Excel_small

Next step will be to add a common Year and Period (and/or Time if you would like) to this schema to allow users to filter more than one fact table (each one by a date type) and display the results in a common time hierarchy.

In our example we will add a DimYear table, a DimPeriod table and a DimTime table (yes I like to give users a lot of flexibility when filtering by dates!):

PDDiagram

And the relationships:

PDDimensionUsage

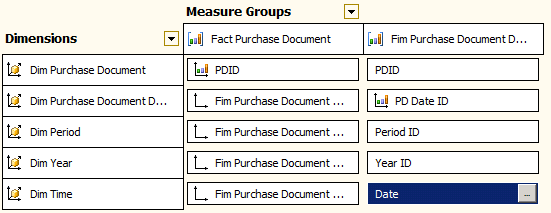
In summary, this solution is not that different to the conventional one where you have the DimTime table in the middle filtering all the Fact tables around it (to which ones it has relationships of course). The “new” concept introduced is that you now have an intermediate table (in our case DimPurchaseDocumentDates) that acts as filter for the Date Type field.

Last but not least, a screenshot of the Dimensions usage with two measure groups (Fact Purchase Document and Fact Purchase Document Item, where the former is the header of the later as in a normal bill with a table for the bill header and a table for the bill items):

2 measure groups

I hope it’s all clear and it helps you to resolve this quite complex problem. If you have found a better solution, please comment and let us know.

Tagged with:
Posted in SSAS

Because is better to have a map…

… than to wander around with no clue where are you heading. Specially if you are in the middle of the SAP tables jungle.

Download the SAP Tables Map: SAP Tables Relation Diagram

Posted in SAP

Memory monster SSIS Sort transformation

For a while I had an SSIS package being unable to complete in the production environment but which worked perfectly in development. To make matters more interesting the package will not always fail… oh! “Welcome back!” That was what I was hearing in my head over and over again.

So I decided to investigate a bit and my findings led me to the following screenshot:

Image

So here we have the problem. Production server was screaming ‘Not enough memory!’ like StarCraft game when saying ‘Not enough minerals’…

First reaction from my side: Let’s go and ask for more memory ^_^

On a second thought I dig a bit more and if you read the first entry in the log you will see that it mentions that the Sort Input component was the one complaining. So it turned out that there was not enough free memory to allocate half a million rows in memory to do a Sort transformation (needed as there are several Merge transformations on that SSIS package later). FYI, Sort transformations require to load all the records in memory to do their job, thus eliminating the benefits of the cascade architecture that SSIS is so proud of.

Ok, so now I have the troublemaker identified and with the help of computer IT’s best friend, Google, I found an ok solution to the problem: Use ORDER BY when querying your data source and configure the data source task to identify the ordering.

First thing that you need is to add an ORDER BY order to your SQL command when fetching your data (more on this later). So in my case it looks like SELECT …blabla… FROM X ORDER BY EBELN ASC. Being EBELN the field used in the Sort transformation.

Image

Then close this task editor and right click on it and choose Show Advanced Editor…

In the Advanced Editor go to the ‘Input and Output Properties’ tab and click on OLE DB Source Output. Change ‘IsSorted’ property to True. This marks the output dataset as sorted.

Image

Last but not least you need to tell which columns and in which order the dataset is ordered by. Open the Output Columns folder and set the ‘SortKeyPosition’ property to 1, 2, 3… for the columns included in the ORDER BY command. Note that 0 is the value by default and marks that column as not part of the ORDER BY.

Image

As in my case I have only one column, EBELN, in the ORDER BY command I only need to set the SortKeyPosition property equal to 1 in the EBELN column. If your ORDER BY looks like ORDER BY EBELN, EKGRP, LIFNR you will set up the SortKeyPosition to 1 for EBELN, to 2 for EKGRP and to 3 for LIFNR.

Ok, now that I have explained how to the trick let me explain why is just an ok solution. The main reason is that this solution will only work if your data source supports an ORDER BY command, so mainly databases. As I explained before my main data source is SAP. When I designed the BI architecture I created a staging database between SAP and the BI database (the one that feeds directly the cubes). The idea was to minimize the time querying SAP and to have a common set of data to later build the fact and dimension tables. Well now I found a new good reason to have a staging database. The SAP adapter provided by Microsoft doesn’t support ORDER BY, so you need first to load the data in the staging database and from there to your BI database and this time using ORDER BY.

If you Google a bit you will find commercial SSIS transformations that sort records using temporary files on disk. I really like that solution but you need to pay for it, and we don’t really like to pay for stuff, do we?

Tagged with: , ,
Posted in Errors, SSIS

Use MDX in PPS KPIs before it is too late

We don’t like MDX… well I don’t. It is complicated, long and there are many ways to go around it to bother to learn it. But every now and then MDX is useful and with PerformancePoint Server I’ve found where our old friend can help:

Maybe it happened to you that you created a scorecard with KPIs defined in PPS in the UAT environment and later you tried to move/copy that scorecard to the Production environment. Once you have succeed in moving/copying the PPS items to Production and load them into a new Workspace you may find, with dismay, that none of the items actually worked. KPIs maintain their configuration, but for some reason they refuse to work (and yes I tried to open them, edit something, save them back to refresh PPS metadata, etc. Nothing seemed to work). Then, the only solution that you have is to recreate the KPIs manually… which is quite frustrating boring, etc… But! It just happens that this is not the case if you use MDX to declare your KPIs… 🙂 So it is time to click that “Use MDX tuple formula” check box and learn a bit of MDX… It is not that difficult… After a while you even will like it as I do 😉

KPI with MDX

Here is an example to display a KPI’s measure called “Aggregated Actual”, for the Attrition KPI (including hierarchy path) and filtered manually by year 2013 and dynamically by the current month:

([Measures].[Aggregated Actual], [Dim KPI].[CS2013 KPIs].[ORYX GTL].[Valued People].[Attrition], [Dim Year].[Year].&[2013], strtomember("[Dim Period].[Period].&["+ format(now(), "MM")  +"]"))
Posted in PPS

Excel Macro to update filter

  • User: Can we make this month filter to have by default the year to date months selected?
  • Me: … well… I guess I can have a look at it
  • Inside of me: Back to VBA… after 12 years…

So I struggled a bit, with errors 13, 1004… Search on internet and you will find long solutions (if you are lucky) to fix those errors and maybe none like you scenario. Well for me it turned out that a bit of debuging lighted up the bulb and I spotted the source of the 1004 error… just a little and simple Trim() function. The code talks by itself (How much I missed ; ) :

Note: Save first your Excel file as a Macro Enabled file (.xlsm).

Sub Auto_Open()     
  YTDMonth 
End Sub

Sub YTDMonth() 

Dim i As Integer 
Dim m As Integer 
Dim months() As Variant
Dim years(1) As Variant
i = 1 
m = Month(Date) 
ReDim strArray(1 To m)

For i = 1 To m     
    months(i) = "[Dim Period].[Period Name].&[" & Trim(Str(i)) & "]" 
Next i
years(1) = "[Dim Year].[Year].&[" & Trim(Str(Year(Date))) & "]"

ActiveSheet.PivotTables("PivotTable1").PivotFields("[Dim Year].[Year].[Year]").VisibleItemsList = years()
ActiveSheet.PivotTables("PivotTable1").PivotFields("[Dim Period].[Period Name].[Period Name]").VisibleItemsList = months()

End Sub
Tagged with:
Posted in Errors, Excel

SSAS Deployment Wizard Error

This error occurs when you are trying to use the SSAS Deployment Wizard, typically when wishing to deploy a staging/development SSAS database to production. The wizard is unable to complete the deployment with the following error message:

“08001: Named Pipes Provider: Could not open a connection to SQL Server”

The error message even encourages you to have a look in SQL Server Books Online for help. I didn’t have much success, but good old Google yield the following solution:

Problem Description:The SQL Server Client Network Utility has TCP/IP or Named Pipes disabled.

Suggested Actions:

  1. Run the SQL Server Client Network Utility tool by executing cliconfg.exe from the Run window.
  2. Verify that the Enabled protocols by order column lists both TCP/IP andNamed Pipes.

Run this wizard in both source and destination servers to ensure that both servers can use the same communication mechanism.

In my particular case, after doing this step I still had a unable to connect to database X error. This error was due to impersonation configuration in the metadata. Solved by typing the password for the impersonated user in the Deployment Wizard.

Posted in Errors, SSAS

Getting rid of Excel Services scrollbars

Excel Services scrollbards in SharePoint sites… you know, I know, we know… they know! How ugly and annoying they can be. Finally I discovered how to get rig of them, and it is quite easy:

Before screenshot:

Image

On the right hand-side of the screenshot you can see the double scrollbars. The internal one belongs to the Excel Services web part and the external to SharePoint. It doesn’t matter how big you web part is, the scrollbar is always there if you publish your entire sheet or workbook.

You can always publish selected objects in your workbook, which will solve the double scrollbars problem. But this solution won’t work if you use slicers in your Excel files to make it easier for final users to filter report’s data. For this scenario you need to use Names.

In Excel, select the cells that cover your entire report. For example from cell A:1 to Q:33. Then we will give a Name to that area by clicking in the “Formulas”tab in the ribbon and selecting the “Define Name” option:

Image

Give a name to the new Name:

Image

And finally publish only the new defined Name:

Image

Named areas can include any Excel objects, graphs, tables and slicers. Once published you just need to give the enough real state to your webpart to accomodate the published named area and the double scrollbars problem will be gone:

Image

Tagged with:
Posted in Excel, SharePoint

Enter your email address to subscribe to this blog and receive notifications of new posts by email.

Join 25 other subscribers
Categories